

This depends heavily on what you count as a conversion, whether that's a demo booked or a purchase, so there's no single agreed-upon number across the industry. What we can say with real data: the average show-up rate, meaning registrants who actually attend, was 47.7% in 2025, based on 33,786 sessions analyzed in Livestorm's 2026 Webinar Benchmark Report (https://livestorm.co/webinar-benchmark-report-2026).
Webinar Glossary
Webinar metrics
Webinar metrics help to inform webinar organizers about the success and performance of their webinars.
What are webinar metrics?
Webinar metrics help to inform webinar organizers about the success of their webinars. Without webinar success metrics, it can be hard to tell if specific goals are being met. Such metrics can also help companies know when to pivot if their webinar strategy isn’t working. To compare the performance of your webinar strategy against other companies in the same industry, take a look at the webinar statistics we compiled.
What are the most important webinar metrics?
Some key webinar metrics to pay attention to for webinars are the registration rate, attendance rate, conversion rate, replay views, retention rate, engagement, and CTA click rate.
Webinar registration rate
This metrics tracks the number of people that have registered for a webinar. The best webinar softwares track this information with registration pages. Except in cases where attendees are manually invited without using a registration page, or registered through a registration page that is independent of a webinar software.
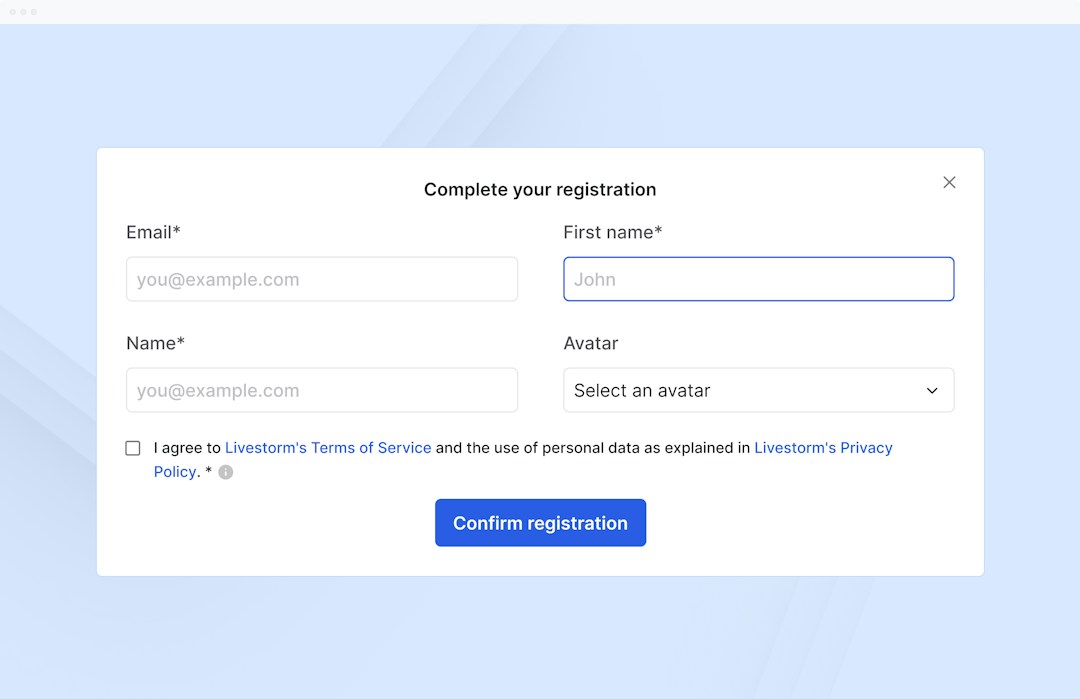
The registration rate is how many people go from the webinar landing page and actually convert to a registration.
What is a good webinar registration rate?
On average, the conversion rate of a webinar registration page is of 30%. But it depends a lot on the origin of the traffic.
If there are not many visits to the landing page then the promotional materials need to be adjusted. If there are many page visits but not a lot of registrations it could be an issue with the registration form being too long. It could also indicate that the wrong audience has been targeted for the content.
Webinar attendance rate
An attendee is a registrant of a webinar who enters the webinar room and watches the event at a designated date and time, whether it’s live or an on-demand webinar.
Contrary to physical events where attendants are usually counted manually, webinar software automatically logs attendees as they enter the webinar room.
To measure how many registrants actually attend the webinar, one must calculate the attendance rate. It can be found by dividing the number of event attendees by the number of registrants and then multiplying by 100.
What is the average webinar attendance rate?
According to Livestorm’s 2026 Webinar Benchmark Report — based on 33,786 webinar sessions and more than 7 million registrations run on the platform in 2025 — the average webinar show-up rate was 47.7%, essentially flat versus 48.9% the year before. In practical terms, a webinar with 175 registrants (the platform average) converts to roughly 83 live attendees and 92 no-shows.
Show-up rate varies by day and season: Tuesday webinars post the highest show-up rate (51.7%), and January is the strongest month overall (50.4%), while July and August lag well behind (45% and 42.9%) due to the summer slowdown.
On engagement, the same dataset found an average watch time of 26 minutes out of a typical 68-minute session, 20.4 Q&A questions per webinar, and 2.77 polls per webinar. Chat is the most widely used engagement feature (90% of sessions), ahead of Q&A (65%) and polls (28%) — though polls remain the most underused given how easily they segment an audience in real time.
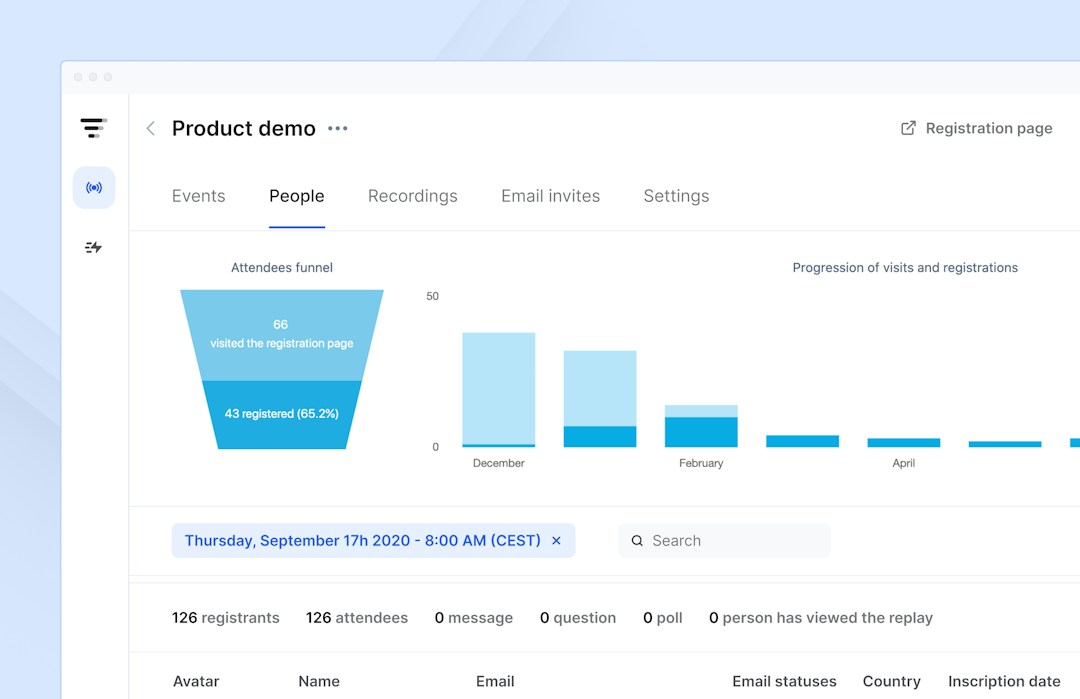
Low webinar attendance metrics can be caused by a failure to promote the webinar to the correct audience. It may also be caused by the day and time of the webinar. At Livestorm, we recommended to hold webinars midweek.
Webinar retention rate
Retention shows how long each audience member stayed during the webinar. Webinar retention metrics can show when attendees leave the webinar room, and hosts can use this information to improve their presentation and their next webinar.
If people drop off after the halfway point of the webinar, it could mean that the webinar is too long. When audience members stop watching after the introduction, it can be a sign that the event was promoted inaccurately.
Engagement metrics (polls, questions, chats)
Metrics that measure engagement include the number of polls, of questions, and of chat messages. Paying attention to these metrics can help when segmenting an audience.
To increase the amount of engagement during a webinar the hosts should let the audience know about these features. Providing incentives may increase the likelihood that audiences will respond to polls and questions. And hosting a Q&A session encourages viewers to discuss in the chat tab.
CTA click rate
On Livestorm, throughout the webinar, hosts have the option to send CTAs to their attendees. These CTAs could be anything from downloading a supporting document to a landing page to purchase a product. The Call to Action metric lets webinar organizers see who clicks on their CTAs.
Viewed replay
This metric tracks which registrants or attendees have viewed the webinar replay. Adding the number of attendees to the number of replay viewers can give a measurement of the global viewership of a webinar.
Editorial & methodology — Written and reviewed by the Livestorm content team. Figures on this page are drawn from the Livestorm 2026 Webinar Benchmark Report (33,786 webinar sessions and 7M+ registrations analyzed). Last updated: July 2026.
Frequently Asked Questions
What is the average webinar conversion rate?
What is the average webinar attendance rate?
47.7% in 2025, according to Livestorm's 2026 Webinar Benchmark Report (https://livestorm.co/webinar-benchmark-report-2026), down slightly from 48.9% the year before. A webinar with 175 registrants, the platform average, converts to roughly 83 live attendees.
Which webinar metric matters most for a sales-focused webinar?
Usually the number of qualified attendees who take a follow-up action, like booking a demo, since raw registration numbers don't reflect pipeline impact on their own.
Do webinar metrics differ significantly by industry?
Yes. Attendance and engagement benchmarks vary by industry and audience, so it's more useful to track your own numbers over time than to chase a single global average.



Try Livestorm for free
Get started in minutes and run your first engaging webinar today.
- No credit card needed
- No installation required